This example shows how to use AWS CloudWatch Logs Insights to analyze logs. You will investigate the logs of a sample application that is made of few functions. The functions generate logs that are sent to CloudWatch Logs. You will use CloudWatch Logs Insights to analyze the logs.
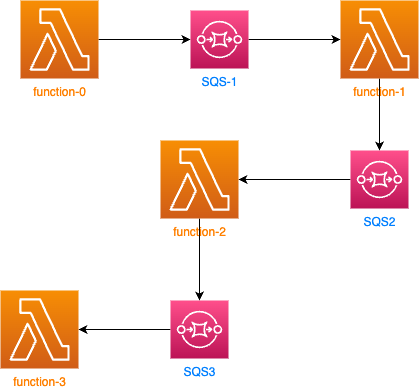
In this task, you will check the resources that were created by the CloudFormation template. The main components are:
- A Lambda function that generates log entries
- A SQS queue that is subscribed to the Lambda function
- A CloudWatch Log Group that receives the log entries from the Lambda function
- In the AWS Management Console, on the Services Search input, search for AWS Lambda.
- Click Functions from the left menu.
- Click on the function that starts with logs-lab-app-test-Function-0.
- On the function overview you will find this funcion is triggered by EventBridge (CloudWatch Events) every 5 minutes.
- Click the Test tab.
- Teh function is configured to generate a log entry every time it is triggered. Click Test few times to trigger the function. You functions should generate a log entry every time it is triggered.
- Click Monitoring tab.
Here you can see the number of invocations, errors, duration and other metrics for the function. Additionally, you can see the Log output of the function. This is the log entry that the function generates every time it is triggered.
- Click View logs in CloudWatch to see the log entry in CloudWatch Logs(new tab will open).
You will see Log streams for each invocation of the function. Click on one of the streams to see the log entry.
Each invocation of the function generates a log entry that looks like this:
START RequestId: 53a56efa-0346-4ef1-b4b1-038314205c18 Version: $LATEST
END RequestId: 53a56efa-0346-4ef1-b4b1-038314205c18
Between the START and END lines you will find the log entry that the function generates. The log entry looks like this:
REPORT RequestId: 7918acf5-a62f-4ae1-af6b-47fcc6445b83 Duration: 226.37 ms Billed Duration: 227 ms Memory Size: 128 MB Max Memory Used: 69 MB And all of the logs your code generates.
But what if your application generates a lot of logs? How can you analyze them? This is where CloudWatch Logs Insights comes in.
In this task, you will use CloudWatch Logs Insights to analyze the logs that the Lambda function generates.
Your application is made of few functions that generate logs. You want to analyze the logs of all the functions together. This can be done by using CloudWatch Logs Insights.
- In the AWS Management Console, on the Services Search input, search for CloudWatch.
- Click Logs from the left menu.
- Click Logs Insights from the left menu.
- Select all the log groups that start with /aws/lambda/logs-lab-app-test-Function-(from 0 to 3).
- Click Run query.
The sample query that is already in the query editor is:
fields @timestamp, @message, @logStream, @log
| sort @timestamp desc
| limit 20
This query returns the last 20 log entries from all the log groups that you selected.
The first line of the query defines the fields that you want to return. The fields are:
- @timestamp - The timestamp of the log entry
- @message - The log entry
- @logStream - The log stream that the log entry belongs to
- @log - The log group that the log entry belongs to
The second line of the query sorts the results by the timestamp in descending order.
The third line of the query limits the results to 20.
In the real world, you will probably want to limit the results. For example you would like to find all the log entries that contain a specific string. You can do this by using the filter command.
In this task, you will use CloudWatch Logs Insights to filter the logs that contain a specific string.
- In the query editor, replace the query with the following query:
fields @timestamp, @message, @logStream, @log
| filter @message like /error/
| sort @timestamp desc
| limit 20
You will look for log entries that contain the string error.
- Specify the time range to be 4 Weeks (click on Custom).
- Click Run query.
- If there is any log entry try to expand it and look for details like this.
- Alternatively, you can click on @logStream URL and see the logs in the CloudWatch Logs console (new tab will open).
Lets assume that each process in your application has a unique messageId. You want to find all the logs that contain a specific messageId.
- In the query editor, replace the query with the following query:
fields @timestamp, @message, @logStream, @log
| filter @message like /BI3gC0LR/
| sort @timestamp desc
- Click Run query.
You should see all the log entries that contain the string BI3gC0LR. Especially look for details in @log column. You will find there from which function the log was generated.
Click on the one of the @logStream URL for Function-1 and see the logs in the CloudWatch Logs console (new tab will open).
QUESTION 1 : Is a the request was successful or not?
Go back to the logs and this time select the latest @logStream URL for Function-2 and see the logs in the CloudWatch Logs console (new tab will open).
QUESTION 2 : Is a the request was successful or not?
If you found any ERROR please try to investigate the issue.
QUESTION 3 : What is the issue?
- In the query editor, replace the query with the following query:
fields @timestamp, @message, @logStream, @log
| filter @message like /myyqbt5W/
| sort @timestamp desc
- Click Run query.
Is the list of logs looks different from the previous one?
You can also look for all of the information that is generated by particular function invocation. You can do this by using the filter command and specify the request id.
- Try to check following query:
fields @timestamp, @message, @logStream, @log
| filter @requestId like /4c1902b6-a44e-5fe2-b7c5-5f34bc6e8ba5/
| sort @timestamp desc
- Click Run query.